IT, Cloud & Cybersecurity • Training
Google Data Analytics Professional Certificate
Job-ready data analytics, beginner to portfolio
Researched and maintained by TestPrepPilot Editorial BoardCloud, IT & cybersecurity certifications desk · Figures last verified August 2026
The short version
What is the Google Data Analytics Professional Certificate and is it worth it?
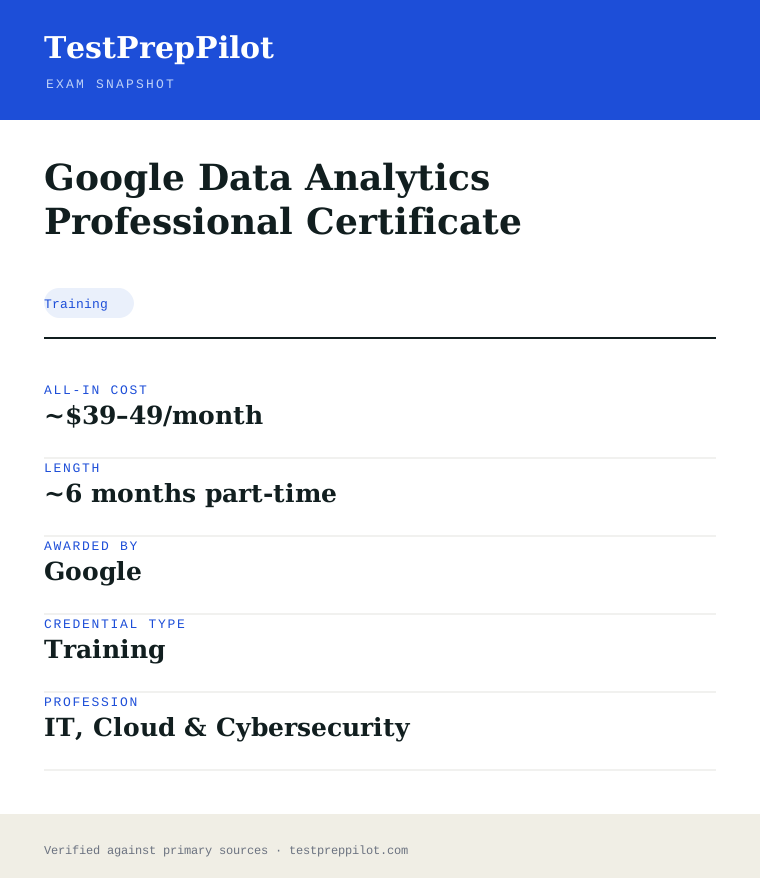
The Google Data Analytics Professional Certificate is a Coursera program (spreadsheets, SQL, R, Tableau, portfolio) completed via courses + capstone — no single proctored exam; pay a ~$39–49/month subscription until you finish; certificate never expires.
- Beginner-friendly
- Portfolio case study
- No proctored exam
- No expiration
What is it?
What exactly is the Google Data Analytics Professional Certificate?
Job-ready data analytics, beginner to portfolio
The Google Data Analytics Professional Certificate is a Coursera-based program that takes beginners to job-ready across the data-analysis process: spreadsheets, SQL, R programming, Tableau visualization and a portfolio case study. It is completed through graded courses and a capstone rather than a single proctored exam, costs a monthly Coursera subscription (around $39–49), and the certificate does not expire.
Before you book
Who is eligible to sit the Google Data Analytics Professional Certificate?
For career changers and newcomers to data analytics.
Who it is for: Aspiring data analysts (beginners)
The test itself
What is the format of the Google Data Analytics Professional Certificate?
The Google Data Analytics Professional Certificate is administered by Coursera and runs Self-paced (~6 months part-time).
| Administered by | Coursera |
|---|---|
| Questions | N/A (course + portfolio) |
| Time limit | Self-paced (~6 months part-time) |
| Pass mark | Course completion |
| Exam fee | Coursera subscription (~$39–49/month) |
| Format | Online courses + portfolio case study |
Content outline
What topics are on the Google Data Analytics Professional Certificate?
The Google Data Analytics Professional Certificate covers 5 content domains.
Weightings come from the official exam outline. Study time is best allocated in roughly these proportions rather than evenly across domains.
- Data analysis process
Ask, prepare, process, analyze, share
- Spreadsheets & SQL
Cleaning, querying
- R programming
Tidyverse, visualization
- Tableau
Dashboards, storytelling
- Capstone
Portfolio case study
Money & time
How much does the Google Data Analytics Professional Certificate cost?
For the Google Data Analytics Professional Certificate, the exam fee is Coursera subscription (~$39–49/month); the all-in cost is typically ~$39–49/month; most candidates spend ~6 months part-time preparing.
Cost breakdown
| Coursera subscription | ~$39–49/month until done |
|---|---|
| Typical total | ~$235–295 (6 mo) |
Financial aid is available; certificate does not expire.
Timeline
- Complete self-paced modules ~6 months
- Finish capstone → certificate completion
Typical prep: ~6 months part-time
The path
How do you register for the Google Data Analytics Professional Certificate?
- 1
Enroll on Coursera5 minutes
Sign up for the Google Career Certificate on Coursera and start the self-paced modules.
- 2
Complete the courseworkstudy phase
Work through video lessons, graded quizzes and hands-on labs at your own pace.
- 3
Build the portfoliocapstone
Complete the capstone case study (Data Analytics) or the regression/ML projects (Advanced).
- 4
Earn the certificatecompletion
Finish all modules to receive the shareable Google Career Certificate.
The fine print
What are the retake and renewal rules for the Google Data Analytics Professional Certificate?
- Proctoring & delivery
- There is no centralized proctored exam. Courses are graded through Coursera quizzes, peer-reviewed assignments and portfolio projects completed in your own environment.
- Retake policy
- Coursera lets you re-attempt graded items and revisit modules at no extra cost beyond the subscription while enrolled.
- Score reporting
- Progress is tracked through Coursera’s course-completion model rather than a single numeric exam score; a certificate is awarded on finishing all required modules.
- Recertification
- Google Career Certificates do not expire and do not require recertification; learners simply keep access to the credential on their profile.
- Refunds & rescheduling
- Coursera offers a 7-day free trial; after that you pay a monthly subscription (around $39–49 USD) until you finish. Financial aid is available for eligible learners.
Context
Google data-analytics certificates (2026)
| Certificate | Focus | Delivery | |
|---|---|---|---|
| Data Analytics | Sheets, SQL, R, Tableau | Coursera subscription | |
| Advanced Data Analytics | Python, stats, ML | Coursera subscription |
What it pays
How much does this credential pay?
$112,590 median for data scientists (BLS, May 2024) — with an entry-level caveat
The Google Data Analytics Professional Certificate feeds the data workforce, and the closest formal occupation in the Bureau of Labor Statistics taxonomy is Data Scientists, SOC 15-2051, which had a May 2024 median annual wage of $112,590, with the lowest 10 percent earning under $63,650 and the highest 10 percent over $194,410. The honest caveat must be stated plainly: this certificate produces entry-level data analysts, and the BLS data-scientist median reflects a senior, degree-heavy occupation that most certificate holders will not reach on day one — the realistic entry rungs for a fresh certificate holder are junior analyst roles that pay well below the $112,590 median, with the growth path toward that number coming from experience and further skills. BLS counted 245,900 data scientists in 2024 and projects 34 percent employment growth from 2024 to 2034 — one of the fastest-growing occupations tracked — with about 23,400 openings a year. The certificate's structural value is that the analyst funnel is large and the tools it teaches (spreadsheets, SQL, Tableau, R) are the actual daily tools of analyst work, so the credential functions as a skills proof point for entry roles rather than a licence. For candidates deciding between this and a degree path, the honest framing is that the certificate is the fast, low-cost way to qualify for analyst interviews, while the wage ceiling above the entry rung is set by years of experience, statistical depth and business domain — none of which the certificate alone provides.
| Measure | Figure | Source / note |
|---|---|---|
| Median annual wage, data scientists | $112,590 | BLS Occupational Outlook Handbook, May 2024 — reflects a senior occupation; entry-level analyst roles pay below this |
| Lowest 10 percent | less than $63,650 | BLS OOH Pay tab, May 2024 |
| Highest 10 percent | more than $194,410 | BLS OOH Pay tab, May 2024 |
| Employment, 2024 | 245,900 jobs | BLS OOH Quick Facts, 2024 |
| Projected annual openings | ~23,400 per year | BLS OOH Job Outlook, 2024-34 — 34% growth, one of the fastest-growing occupations |
Job growth.+34% projected change 2024-34 (much faster than average), ~23,400 openings a year. The certificate is an entry-analyst ramp; the cited median reflects a senior data-scientist occupation, so treat it as the ceiling trajectory, not the starting salary.
Your odds
What are the pass rates?
No exam, no pass rate — this is a completion-based programme
The Google Data Analytics Professional Certificate is not a proctored exam and has no pass rate, no cut score and no retake policy in the traditional sense — it is a sequence of eight courses on Coursera, each assessed by graded quizzes, hands-on activities and a final graded assessment, and you earn the certificate by completing the courses. We state this plainly because it changes what "passing" means: there is no single high-stakes sitting to fail, and Google does not publish a verified statistic on what share of enrolled learners finish the programme. Google reports aggregate claims about its Career Certificates (for example, that a large share of graduates come from groups underrepresented in tech and that the certificate is accepted by a consortium of employers as meeting a job-qualification threshold), and the alumni-outcomes numbers Google publishes come from its own graduate surveys rather than from an independent audit — treat them as marketing-grade figures, not verified statistics. What is verifiable is the structure: roughly eight courses (Foundations of Data Analytics; Ask Questions to Make Data-Driven Decisions; Prepare Data for Exploration; Process Data from Dirty to Clean; Analyze Data to Answer Questions; Share Data Through the Art of Visualization; Data Analysis with R Programming; and a capstone project), each ending in graded assessments that require a passing score — typically 80 percent or the course's stated threshold — with unlimited retakes of individual quizzes. The practical implication is that the "exam strategy" here is consistency and project completion, not cramming: the failure mode is dropping out mid-programme, not failing a sitting.
Read this before quoting the number.This is a completion-based certificate with no proctored exam, so no pass rate exists. Individual courses require a passing score on graded assessments (typically ~80%), with unlimited quiz retakes; Google's published graduate-outcome figures come from its own surveys, not an independent audit.
Source: Google — Data Analytics Professional Certificate (Coursera)
Your schedule
How long should I study for it?
180-200 hours of focused study
Because the certificate is a sequence of eight graded courses rather than a single exam, the plan is about sequencing, hands-on practice and scheduling, not cramming. The full programme is roughly 180-200 hours of self-paced content, and the Coursera estimate is around six months at under 10 hours a week. The courses build in a deliberate order: foundations and asking good questions first, then data preparation and cleaning, then analysis and visualisation, then R programming, and finally a capstone project that applies everything — and the capstone is the point where learners who skimmed the tools hit a wall. The plan below runs twelve weeks at roughly 8-10 hours a week for someone in no particular hurry, with the first four weeks on the foundations-to-cleaning arc, the middle four weeks on analysis and visualisation, and the final four weeks on R programming plus the capstone. The single most important structural fact is that the programme is tool-heavy by design — spreadsheets, SQL, Tableau and R are taught and then used in graded activities — so the hands-on work is the actual curriculum; a learner who watches every video but never opens the tools will pass few graded activities and learn nothing interviewable. If you already use spreadsheets and SQL at work, you can compress the early courses substantially, but do not skip the R module or the capstone, because they are the differentiators that employers can probe in interviews.
- Weeks 1-38-10 hrs/week
Courses 1-2 — Foundations and asking questions
- Foundations of Data Analytics: the data lifecycle, roles, and the analyst mindset
- Ask Questions to Make Data-Driven Decisions: structured thinking, defining problems, stakeholder expectations
- Complete the module assessments as you go and practise framing real business questions
- Set the weekly cadence now — completion depends on consistency, not intensity
- Week 49-11 hrs
Course 3 — Prepare Data for Exploration
- Data types, data structures, databases and best practices for organising data
- Do the spreadsheet and database activities hands-on — the tools are the curriculum
- Take the graded assessments promptly after each module
- Start keeping a portfolio of the datasets you prepare
- Weeks 5-68-10 hrs/week
Course 4 — Process Data from Dirty to Clean
- Data cleaning: handling missing values, duplicates, inconsistent formatting, SQL cleaning queries
- Complete the SQL and spreadsheet cleaning exercises — this is a core interview skill
- Practise documenting every cleaning decision, as the course grades documentation
- Keep your own cleaning checklist you can reuse in the capstone
- Weeks 7-88-10 hrs/week
Course 5 — Analyze Data to Answer Questions
- Analysis workflows, aggregations, and drawing defensible conclusions from data
- SQL and spreadsheet analysis exercises hands-on
- Practise explaining what the numbers mean in plain language — the course grades communication
- Relate every technique back to the business questions from Course 2
- Week 99-11 hrs
Course 6 — Share Data Through the Art of Visualization
- Data visualisation principles and Tableau basics: building clear, honest charts and dashboards
- Complete the Tableau activities hands-on and build a portfolio dashboard
- Practise presenting a data story end to end
- Take the graded assessments on time
- Weeks 10-119-11 hrs/week
Course 7 — Data Analysis with R Programming
- R basics: data types, tidyverse workflows, and simple analysis and visualisation in R
- Complete the R exercises hands-on — many learners underestimate this module
- Replicate an analysis from the earlier courses in R to consolidate
- Do not skip this course even if SQL feels sufficient; it is a course gate and an interview differentiator
- Week 129-11 hrs
Course 8 — Capstone project
- Work a real analyst-style scenario end to end: define the question, prepare and clean the data, analyse, visualise, present
- Apply the full toolkit — spreadsheets or SQL plus Tableau and R where appropriate
- Finish the graded assessments and claim the certificate
- Polish the capstone into a portfolio piece for interviews and LinkedIn
Adjusting the pace
Working analyst adding formal credentials.Six to eight weeks at 8-10 hrs/week. Compress the early spreadsheet courses; invest the recovered time in R programming and a strong capstone portfolio.
Career changer, no data background.Sixteen to eighteen weeks at 6-8 hrs/week. Add four weeks before Week 1 on spreadsheet fundamentals; protect the weekly cadence, which is the real success factor.
Full-time job-seeker, 15-20 hrs/week.Eight to ten weeks. Keep the course order intact; the capstone cannot be rushed, and the tools must be practised, not watched.
How to study
How do I prepare most effectively?
The success levers for this programme are hands-on tool practice, portfolio building and sequencing — not test-prep tactics, because there is no single high-stakes exam. The strategies below are ordered by what actually completes the certificate and converts it into an interview-ready skill set.
Treat the tools as the curriculum, not the videos
The programme teaches spreadsheets, SQL, Tableau and R, and the graded activities require using them. A learner who watches every video but never opens the tools passes few activities and learns nothing an interviewer can probe. Reproduce every demonstrated action in your own copy of the tool — the hands-on work is the actual credential.
Build a portfolio as you go, not at the end
The capstone produces one portfolio piece, but the strongest candidates assemble several: a cleaning project from Course 4, a dashboard from Course 6, an R analysis from Course 7. Keep each graded project in a folder with a short write-up. Interviewers for analyst roles ask "show me something you built", and a multi-project portfolio answers that directly.
Protect the weekly cadence above all
The certificate has no deadline pressure and no single failing point, so the dominant failure mode is dropout, not failure. Learners who schedule a fixed weekly block finish; learners who wait for motivation stall around course four. Treat the weekly block as non-negotiable.
Finish one course before starting the next
The courses build on each other — cleaning assumes preparation, analysis assumes cleaning, R assumes the analysis mindset. Bouncing between courses leaves gaps the later activities expose. Complete each course's assessments before moving on.
Practise explaining findings in plain language
The programme grades communication — turning numbers into a recommendation a stakeholder can act on. Practise writing one-paragraph summaries of each analysis you complete. This is the skill that separates certificate holders who get analyst jobs from those who do not.
Stack it deliberately toward a first analyst role
The certificate is an entry credential whose value is proven in interviews through the portfolio and tool fluency. Pair it with a targeted job search for junior analyst titles and with SQL practice beyond the course if you are weak in it — SQL is the most-tested tool in analyst interviews.
What to buy
Which study resources are worth paying for?
The certificate itself is the curriculum, delivered on Coursera under a monthly subscription and including all required course materials, labs and assessments. The real decisions are (1) whether to pay the subscription for several months versus finishing within fewer billing cycles, and (2) which free supplements close the tool-practice gap — especially SQL and portfolio projects.
| Resource | Price | Format | Best for |
|---|---|---|---|
| Google Data Analytics Certificate on Coursera | ~$49/month subscription (typically 1-4 billing cycles at the recommended pace) | Self-paced video, hands-on activities and graded assessments | Required — the full curriculum, materials and certificate |
| Coursera financial aid | Free for approved applicants | Same course access, application required | Learners who cannot afford the subscription |
| Tableau Public (free) + RStudio | Free | Software for visualisation and R work | Reproducing the course tools hands-on and building portfolio pieces |
| SQL practice platforms (e.g., SQLZoo, LeetCode SQL) | Free to low-cost | Interactive SQL exercises | Closing the SQL gap beyond the course — the most-tested analyst skill |
| Kaggle datasets and competitions | Free | Real datasets and community projects | Portfolio building and applying the tools to real data |
Prices checked 2026-08 in USD before promotions; the Coursera subscription and programme structure change periodically, so confirm the current fee and course list on the official page. We do not rank by commission.
Avoid these
What mistakes do candidates most often make?
Because this credential fails by attrition rather than by a single exam, the mistakes that matter are behavioural and skill-based: dropping out mid-programme, watching instead of doing, skipping R, and failing to build a portfolio. The six traps below are the recurring ones in learner post-mortems.
✕Starting all eight courses at once
✓The courses build on each other, and the later activities assume the base. Enroll one course at a time and complete its assessments before moving on. Bouncing between courses is how learners end up with several half-finished courses and no certificate.
✕Watching the videos without using the tools
✓The graded activities require spreadsheets, SQL, Tableau and R — not video recall. Reproduce every demonstrated action in your own copy of the tool. A certificate earned by watching alone will not survive an analyst-interview skills test.
✕Skipping the R programming course
✓R is a full course gate and one of the programme's differentiators. Learners who skip it or guess through it lose a course and an interview advantage. Do the R exercises hands-on, even if SQL feels sufficient — many analyst roles list R or Python, and the certificate covers R.
✕Never building a portfolio outside the capstone
✓The capstone produces one project, which is the minimum. The strongest candidates keep a cleaning project, a dashboard and an R analysis from the earlier courses. Interviewers for analyst roles ask "show me something you built" — arrive with more than one answer.
✕Quoting Google's outcome statistics as verified facts
✓Google's graduate-outcome figures come from its own surveys and marketing materials, not from an independent audit. In interviews and resumes, describe what you actually did — the tools you used, the projects you completed — not unaudited percentage claims.
✕Treating the certificate as a substitute for SQL and statistics depth
✓The certificate is an entry ramp; SQL fluency and statistical judgement are what analyst interviews actually test beyond it. Pair the certificate with extra SQL practice and a portfolio, and be honest with yourself about which skills need more reps before applying.
What you'll face
What question types will I see?
There is no single proctored exam, so "question types" here means the graded assessment formats across the eight courses: module quizzes (multiple choice, true/false, matching), hands-on activities in spreadsheets, SQL, Tableau and R with pass/fail grading, and course-final graded assessments. Individual quizzes allow retakes, but each course requires a passing score (typically 80 percent or the stated threshold) to progress. The hands-on activities are the distinctive part: you work in the actual tool — writing a SQL query, cleaning a dataset, building a chart or dashboard, running R code — and are graded on completing the task correctly. The capstone project synthesises the courses: you take a realistic analyst scenario, define the question, prepare and clean the data, analyse it, visualise the results, and present the findings. Because the grading is completion-based with retakes, the "tactics" that matter are doing the activities for real, keeping the sequence intact, and treating every graded project as portfolio material — not test-day strategy.
Multiple choice, true/false and matching on the module's content. Retakeable; used to reinforce rather than gate.
Real work in spreadsheets, SQL, Tableau or R; graded on completing the task correctly in the tool.
The gate for each course; requires a passing score (typically ~80%) covering the whole course.
An end-to-end analyst scenario: define the question, prepare and clean the data, analyse, visualise, present.
Try these
Q1A dataset of customer orders contains 30 rows with a NULL value in the "customer_id" column, and several orders appear twice with identical values. What is the correct first step in cleaning this data?
Answer:B
The course's cleaning methodology is investigate before decide: understand why values are missing or duplicated — data-entry errors, a broken import, a join that multiplied rows — before choosing a fix (B). A deletes data without understanding it, risking a systematic data-entry cause going unaddressed. C fabricates values and corrupts the analysis. D mistakes the goal; cleaning is expected, but it must be informed by investigation and documented. The course grades both the cleaning and the documentation of each decision.
Q2Which SQL clause filters rows to only those meeting a condition?
Answer:B
WHERE filters rows by a condition before aggregation (B). SELECT (A) chooses columns. ORDER BY (C) sorts results. GROUP BY (D) aggregates rows into groups. This is the level of SQL recall the course's graded activities and analyst interviews test directly — the discriminator is which clause restricts the row set.
Q3A bar chart comparing monthly sales shows a spike in December that dwarfs every other bar. Before concluding "sales exploded in December", which check is most appropriate?
Answer:B
An outlier that dominates a visual warrants verification before interpretation — a data-entry error, a duplicated import, or a processing issue (such as a return being counted as a sale) could explain it (B). A interprets without verification. C and D manipulate the visual, which is exactly the kind of misleading chart the visualisation course teaches against. The course grades honest, documented analysis over dramatic findings.
Samples are editor-written illustrations of the programme's assessment style, not actual graded items.
The big day
What should I expect on exam day?
There is no single exam day for this certificate — the "day" is the schedule you keep across the programme and the moment you complete the capstone. Practically, that means the equivalents of exam-day preparation are: (1) protecting the final capstone week, because it applies every tool and cannot be rushed; (2) making sure your software environment works before the graded tool activities — spreadsheets, a SQL environment, Tableau and RStudio — since the activities require executing real work; and (3) confirming your Coursera account and billing are in order so the certificate issues cleanly when you finish. The common pitfalls on "completion day" are administrative: an expired subscription that pauses access mid-course, a missing course-final assessment that blocks progression, or an R environment that fails to install packages during the graded exercises. On the day you complete the final course, the certificate is issued on Coursera and appears in your profile; you can share it to LinkedIn and download it for your resume. Unlike a proctored exam, there is no score report and no retake policy — if a course assessment falls short, you review the relevant modules and retake it. The credential is earned entirely through the platform, has no expiry, and is permanent as long as you retain access to the record.
Bring
- A reliable computer with the course tools installed (spreadsheets, SQL environment, Tableau, RStudio)
- Your Coursera account credentials and an active subscription
- A project folder for portfolio pieces as you complete each graded project
- A fixed weekly schedule — the real "exam-day" discipline for a completion-based certificate
Leave at home
- The mindset that you can binge the capstone in one weekend — it applies every tool and needs a week
- Unfinished module assessments — they block the course-final gate
- The temptation to watch the videos and skip the hands-on activities
How the day runs
Rules in the room
- Completion-based: no proctored exam, no cut score, no retake policy — each course requires passing its graded assessments.
- Course-final assessments are the gate; module quizzes are retakeable and reinforce rather than gate.
- Hands-on tool activities are graded on completing the task correctly in the actual tool.
- An active Coursera subscription is required to keep access; an expired subscription pauses your progress.
- The certificate is lifetime once issued; there is no renewal or continuing-education requirement.
Afterwards.When you complete the final course, the certificate is issued on Coursera and appears in your profile, ready to share to LinkedIn and attach to applications. There is no score report because there is no exam — your evidence is the completed programme and, more importantly, the portfolio of projects you built along the way and the tool fluency you can demonstrate. The credential has no expiry, which is both a convenience and a caution: nothing forces you to keep the skills fresh, so the next step matters. The strongest moves after completion are to deepen SQL fluency (the most-tested analyst skill), polish your portfolio into interview-ready pieces, and target junior analyst roles with applications that show the projects rather than just the certificate. In interviews, expect skills tests and "show me what you built" questions — answer with the tools and projects, and be honest about which areas you are still building. If you aimed the programme at a specific industry, the follow-up is to learn that domain's data (e.g., marketing, finance, healthcare) so your portfolio speaks the interviewer's language.
Reference
What are the key facts about the Google Data Analytics Professional Certificate?
Google Data Analytics Professional Certificate is a training credential; awarded by Google; the exam fee is Coursera subscription (~$39–49/month); typical preparation is ~6 months part-time; holders typically earn $60,000–$90,000.
| Credential | Google Data Analytics Professional Certificate |
|---|---|
| Abbreviation | Google Data Analytics |
| Type | Training |
| Profession | IT, Cloud & Cybersecurity |
| Specialty | Google Cloud & Google |
| Awarded by | |
| Difficulty | Easy |
| Typical prep time | ~6 months part-time |
| All-in cost | ~$39–49/month |
| Typical salary range | $60,000–$90,000 |
| Delivery | Coursera |
| Exam | None (portfolio) |
| Cost | ~$39–49/month |
| Expiration | None |
| Scope | National / Multi-state |
| Also known as | Google Data Analytics Certificate |
Real questions
Frequently asked questions about the Google Data Analytics Professional Certificate
Is there a proctored exam?
No. You complete graded courses, labs and a portfolio case study on Coursera; there is no single supervised exam.
How much does it cost?
You pay a monthly Coursera subscription (around $39–49 USD) until you finish; financial aid is available.
How long does it take?
Google estimates about six months at roughly 10 hours per week of part-time study.
Does it expire?
No. The certificate does not expire and requires no recertification.
Do Google Career Certificates require a proctored exam?
No. They are completed on Coursera through graded quizzes, labs and a portfolio case study rather than a single proctored test. You pay a monthly subscription until you finish.
How long do they take?
Google estimates about six months of part-time study (~10 hours/week) for the Data Analytics certificate; the Advanced certificate builds on it.
Do they expire?
Google Career Certificates do not expire and require no recertification.
In short
Is the Google Data Analytics Professional Certificate worth it?
- Google Data Analytics Professional Certificate (Coursera).
- Spreadsheets, SQL, R, Tableau, portfolio.
- No proctored exam; ~$39–49/month.
- ~6 months; never expires.
Same awarding body
What other credentials does Google award?
Worth comparing
How does the Google Data Analytics Professional Certificate compare with similar credentials?
Trust
Where does this information come from?
Everything above is taken from the awarding body's own published material. Fees, question counts and domain weights are revised regularly — check the official page before you pay.
- Google Awarding body
Research confidence: high · Last reviewed 2026-08